Sep 26, 2021 Energy Equity Analysis
This write-up will discuss energy equities and their short and medium term outlook.
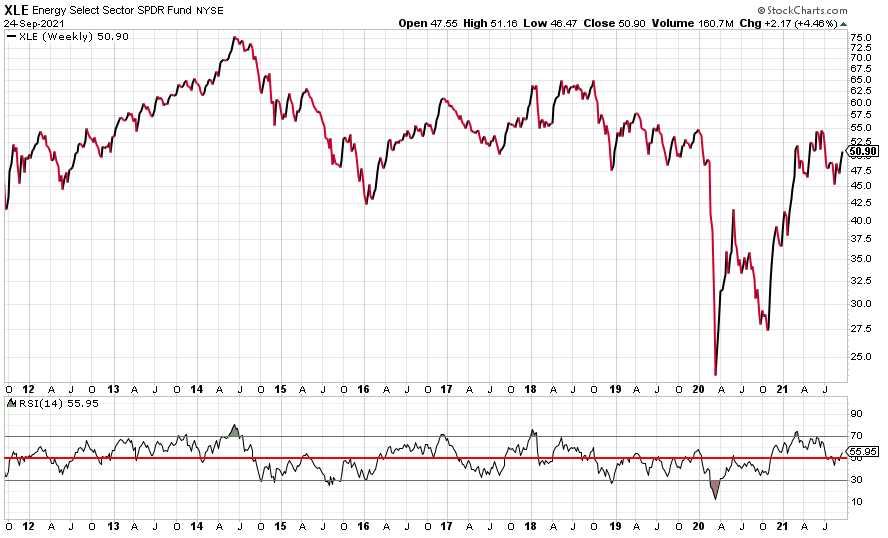
The above chart suggests that energy equities are still in a bull market. The 50 level on the weekly RSI has been in important inflection point over the last 10 years. The theory is that 50 on the weekly RSI is the inflection point between medium term momentum being positive or negative. The chart illustrates that when XLE spends an extended period of time below the 50 level, it’s forward returns are often underwhelming. Medium term momentum is now positive so being invested in energy is certainly justifiable.
Energy also looks bullish over the short term. The above chart is the 10 day moving average of the daily RSI. It recently spent a significant amount of time sub 50 meaning that short term momentum was negative for an extended period of time. The 10 day moving average has now broken above 50; since the Covid crash, energy equities have seen significant increases over the short term after this has happened. This data point suggests energy will be a strong sector in the immediate future.
The above chart is energy’s bullish percent index. Energy has a seemingly unique characteristic (I say seemingly because I haven’t signal tested this on every sector) whereby it’s forward returns are underwhelming after it suffers a breadth breakdown. On this chart, I mark the 35% level as a breadth breakdown. The vertical red lines mark a breakdown in breadth and the vertical blue lines mark when breadth has been repaired. Strong breadth is a pre-requisite for a strong rally in energy - the chart above outlines that strong rallies simply don’t occur when breadth is weak. For traders, the 35% level can signify important levels to either exit or enter energy. This data point is bullish as energy currently has strong breadth.
Oil itself is on the cusp of a major breakout. This point doesn’t require much analysis, if and when oil breaks out, it will be a tailwind for energy equities.
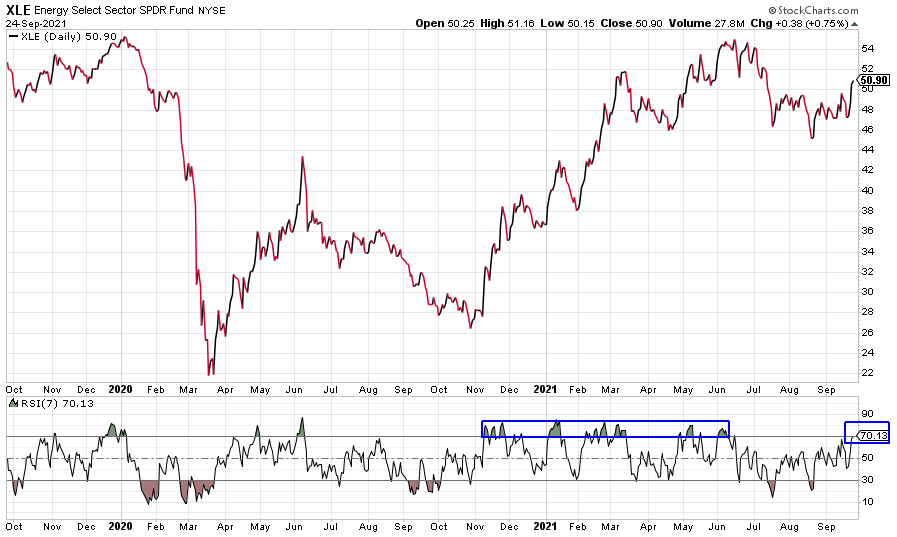
The above chart is the RSI-10 on XLE. XLE has just moved above 70 on the RSI-10 which can mark levels where XLE takes a very short breather. As oil and the S&P futures are currently up overnight, it looks likely that this will move up even higher tomorrow. I will likely wait for a very small pull back in XLE whereby the RSI-10 goes sub 70 before entering a trade. If I do enter a trade, I will have defined stop level where I will exit if the trade goes south.
This write up is strictly my opinion and doesn’t necessarily reflect the views of my employer. It is for informational purposes only and is not investment advice. Please come to your own conclusions and invest accordingly.
Troy Trentham, CMT


